

Jason Collins said something last spring that we here at Vantage Sports have been waiting to hear an NBA player admit for a long time. Spoiler alert – it had nothing to do with his sexual orientation.
“My contributions don’t show up in the box scores.” 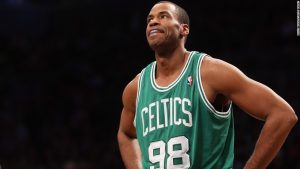
What Collins meant is that his game involves moves that improve other players’ box scores. As he explains, “I set picks with my 7-foot, 255-pound body to get guys like Jason Kidd, John Wall and Paul Pierce open.”
 Screens are crucial to every team’s success. Screens are the only tool a player has to legally contact a defender, creating space for a teammate to either score or facilitate a score. Collins’s abilities have been rewarded with an NBA salary for more than a decade, yet have never been effectively tracked or measured. Notice that there is no “effective screens” line item in your NBA box score. Vantage Stats changes that by measuring both screening effort and efficiency.
Solid Screen % and Screens Per Chance
A good screen requires more than a big body (or as John Stockton proved, a not-so-big body). The fundamental job of the screener is to create space either through contacting the defender or forcing the defender to adjust his path.
Vantage tracks a player’s “Solid Screen %”. This is the percentage of set screens (both on-ball and off-ball) where a player either makes contact with a defender, or re-routes that defender. This statistic excludes slip screens (times where the screener rolled or popped prior to the receiver getting to the screen).
Here are the top 5 NBA big men in Solid Screen % over the past two seasons (with minimum offensive chances and screen attempts) along with their Screens Set Per Chance:
1. Ronny Turiaf (79% Solid) (.49 per chance)
2. Nick Collison (78.3% Solid) (.44 per chance)
3. Marcin Gortat (78% Solid) (.63 per chance)
4. Joakim Noah (77.5% Solid) (.47 per chance)
5. Kenyon Martin (77.2% Solid) (.42 per chance)
Set Screen Points Per Chance
Here are the top 5 NBA bigs in Set Screen Points Per Chance over the past two seasons (again, with minimum offensive chances and screen attempts):
1. Tiago Splitter (.123 points per chance)
2. Kendrick Perkins (.117 points per chance)
3. Joel Anthony (.11 points per chance)
4. Tyson Chandler (.108 points per chance)
5. Marcin Gortat (.107 points per chance)
Your mind is probably jumping ahead of itself at this point, thinking about the scorers using those screens, right? Indeed, Tony Parker’s uncanny/gymnastic/otherworldly scoring ability might be inflating Splitter’s numbers here. And full disclosure: Duncan is #6.
This metric therefore suffers from the same bias that box-score assists do. You can’t control your teammates’ ability to hit shots in open space, and those that are surrounded by great scorers are going to look like better screeners in this context. But combined with other metrics, this can be a powerful signal in evaluating underlying factors of offensive efficiency.
Set Screen Outcome Efficiency
2. Joakim Noah (48%)
4. Jason Maxiell (44.8%)
5. Kendrick Perkins (44.7%)
Putting It All Together: Noah Is the Best
3 names appear twice in the 3 lists above, Joakim Noah is in the top 5 in both Solid Screen and Outcome Efficiency. Marcin Gortat is in the top 5 in Solid Screen and Points Per Chance. Finally, Kendrick Perkins is in the top 5 in Efficiency and Points.
Here are a few Noah highlights to get you ready for the season:
Conclusion
Statistics are important because they tell stories. Stories about how much we should value players, who we should praise (or ridicule) and how players are most (and least) effective. Vantage Sports started with the premise that traditional statistics fail to tell the most compelling stories.
Vantage Stats aims to improve the ability to measure performance and track the most meaningful aspects of the games we love. We hope the Jason Collins of 2016 can say, “Clearly, you should sign me. My Solid Screen %, Screen Points Per Chance, AND Set Screen Outcome Efficiency are all off the charts!” In case you were wondering, though he didn’t have the sample size to make it, the Jason Collins of 2012 was a very good screener, posting an 82% Solid, .069 Points Per Chance and 39.5% Outcome Efficiency.